Sustainable Cambridge Dashboard
Start of page content
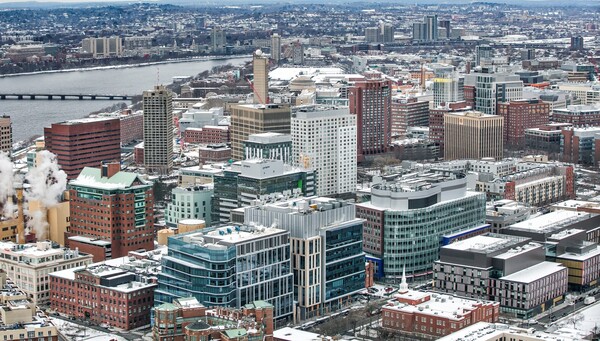
Sustainability in Action
Through careful planning, Cambridge is making progress toward its goals to limit greenhouse gas emissions, adapt to the impacts of climate change, and become more resilient.
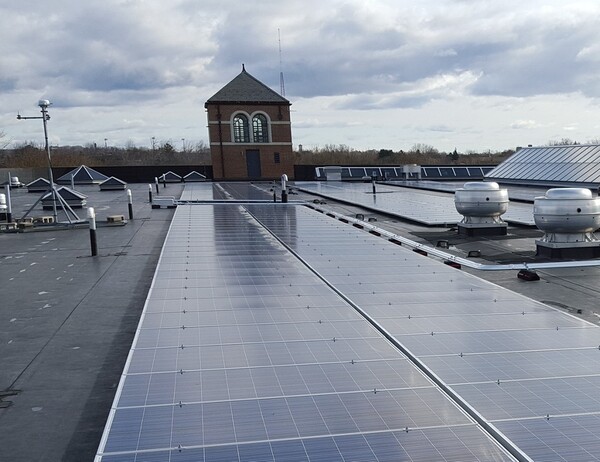
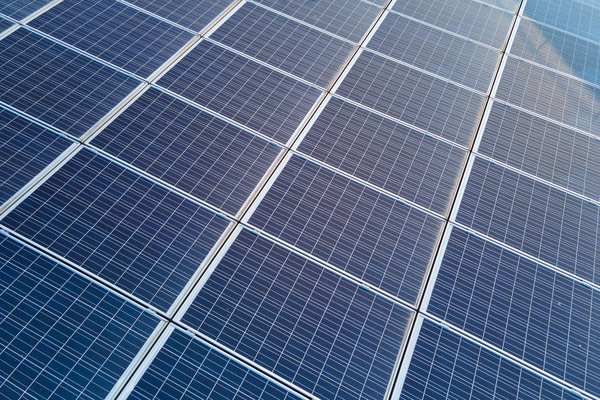
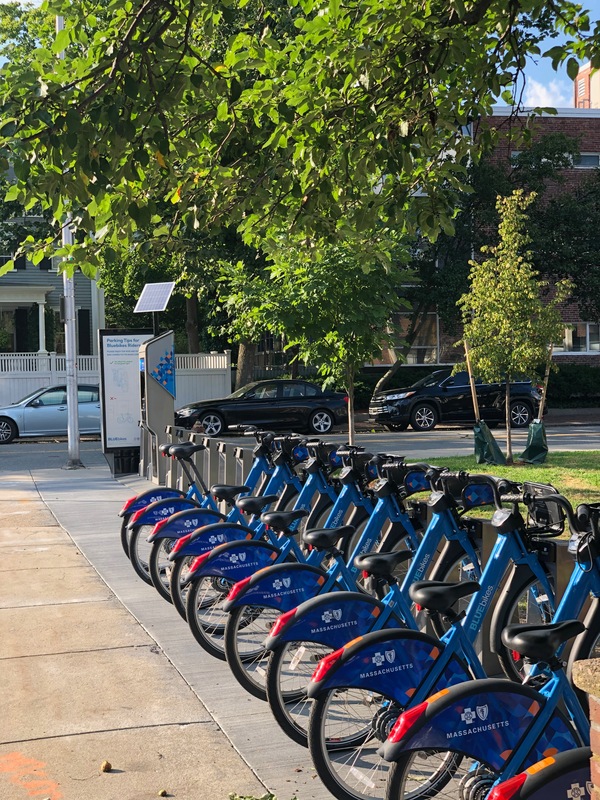
Use this Dashboard to track and understand our efforts to decarbonize buildings and transition to renewable energy, as laid out in the City’s Net Zero Action Plan. Check out the Resilient Cambridge plan, our strategy for mitigating the impact of changing weather, like flooding and extreme heat. And learn how we’re making Cambridge better by increasing our urban forests, encouraging biking and public transit, and reducing our trash.